 TATER
TATER Fleet Management
Track your entire device fleet with compliance scoring, MDE integration, vulnerability analysis, software inventory, CISA KEV enrichment, and smart application discovery.
CMDB Linkage (Configuration Items)
Every device in your fleet also appears as a Configuration Item (CI) in the CMDB. The link is one-way + idempotent:
- Run Auto-Discover from the CMDB page (or
POST /api/cmdb/discover) and TATER imports each device as a CI with typeworkstationorserver(based on OS string). - Workstations get criticality Low by default; servers get High. Adjust per host as needed.
- Deduplication uses
discoveryRefId- running discovery again is safe and only imports new devices. - Once a device is a CI, you can map
runs_on/containsrelationships to applications and services, which feeds the Service Portfolio + Major Incident impact analysis (see CMDB guide + Service Portfolio guide).
When you should care: if you want to know what business services depend on a specific server, or what would be impacted if a workstation pool goes down, the CMDB linkage is the prerequisite. Without it, fleet data lives in isolation.
Vulnerability Inventory (Phase 4)
The TATER Agent uploads a per-device installed-software inventory every 7 days (and on first install). Stored in the DeviceVulnInventories Cosmos container with 30-day TTL.
- Per-device: open
GET /api/agents/:deviceId/vulnsor the device detail page in TATER Manage to see installed software + CISA KEV correlations. - Fleet summary:
GET /api/agents/vulns/summaryrolls up KEV exposure across all devices - used by the Manage app's vulnerability dashboard. - Auto-task creation: when a KEV-correlated CVE shows up in the inventory, an Ops task is auto-created (per-CVE deduped) and routed to the security team.
The Manage app (guide) is the primary surface for fleet remote operations - Phase 2 (remote command channel), Phase 3 (multi-screen viewer), Phase 4 (vulnerability inventory you just read about).
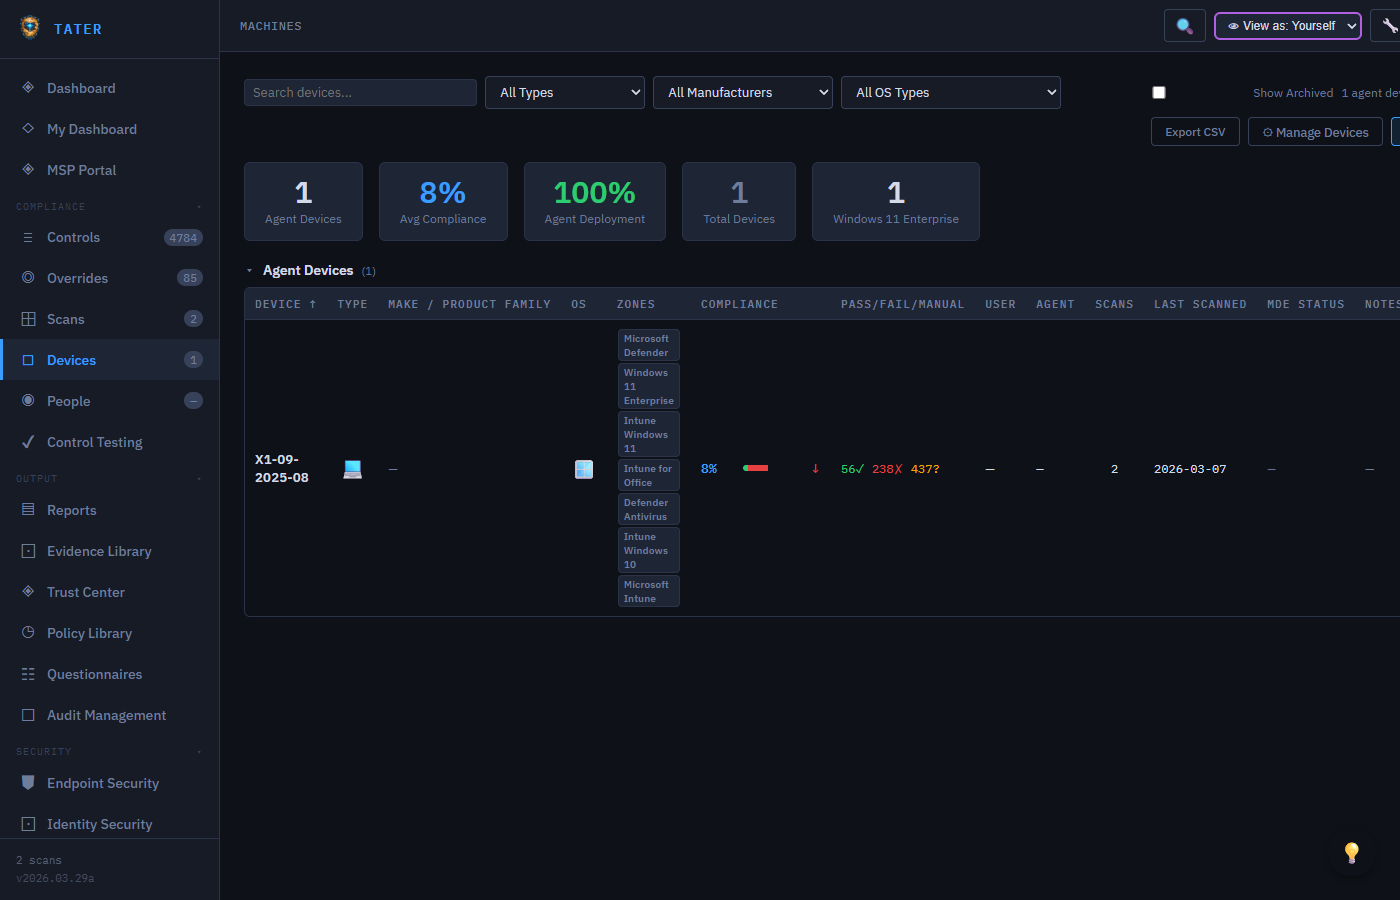
Devices Overview
The Devices page provides a unified view of all endpoints in your organization, combining data from multiple sources:
- Agent-reported devices: Endpoints running the TATER Agent that report compliance scan results and speed tests
- MDE-discovered devices: Devices from Microsoft Defender for Endpoint, automatically bridged into the fleet view
- Intune-managed devices: Devices enrolled in Microsoft Intune with compliance status
Device List
The table is sourced from GET /api/agent/diagnostics, which scans the most recent agent heartbeats and dedupes to one entry per device. The endpoint accepts ?limit=N (default 1000, max 5000) for very large fleets; a _meta.truncated flag in the response surfaces when the window was hit. See the FAQ if devices are missing from the list. The table shows each device with the following columns:
- Name: Device hostname or display name
- Type: Workstation, Server, Mobile, or Virtual Machine
- OS: Operating system and version
- Last Seen: When the device last reported data
- Compliance: Pass rate percentage across evaluated controls
- MDE Status: Defender health status, risk score, or exposure level
- Vulnerabilities: Count of known CVEs affecting the device
Device Detail View
Click any device to open the detail panel with comprehensive information organized into sections:
Hardware & System Information
- Computer name, domain, and organizational unit
- Operating system, version, and build number
- CPU, RAM, and disk information (when reported by the agent)
- Network adapters and IP addresses
- Last boot time and uptime
Speed Test Results
If the device has run a speed test via the TATER Agent, the detail view shows:
- Download speed in Mbps
- Upload speed (if available)
- Latency measurements
- Historical speed test trend
Defender for Endpoint Status
For devices onboarded to MDE, the detail view includes a dedicated security section:
- Health Status: Active, Inactive, Imbalanced, or No Sensor Data
- Risk Score: None, Low, Medium, High (aggregated threat assessment)
- Exposure Level: None, Low, Medium, High (based on unpatched vulnerabilities)
- Onboarding Status: Whether the device is fully onboarded to MDE
- Last Seen: When MDE last received telemetry from the device
- Tags: MDE device tags for grouping and filtering
Vulnerabilities
The vulnerabilities section shows CVEs affecting the device:
- CVE counts broken down by severity (Critical, High, Medium, Low)
- Top 20 Critical and High severity CVEs with NVD links
- CISA KEV flags indicating actively exploited vulnerabilities
- EPSS (Exploit Prediction Scoring System) probability scores where available
- Ransomware campaign associations from CISA KEV data
Vulnerabilities flagged in the CISA Known Exploited Vulnerabilities catalog are under active exploitation and should be prioritized for immediate remediation regardless of their CVSS score.
Installed Software
The software section lists all software detected by MDE on the device:
- Software name, vendor, and installed version
- Weakness count (number of known CVEs for that software version)
- End-of-Life (EOL) flagging with version lifecycle data from endoflife.date API
- Sorting by weakness count to prioritize the most vulnerable software
Endpoint Security Dashboard
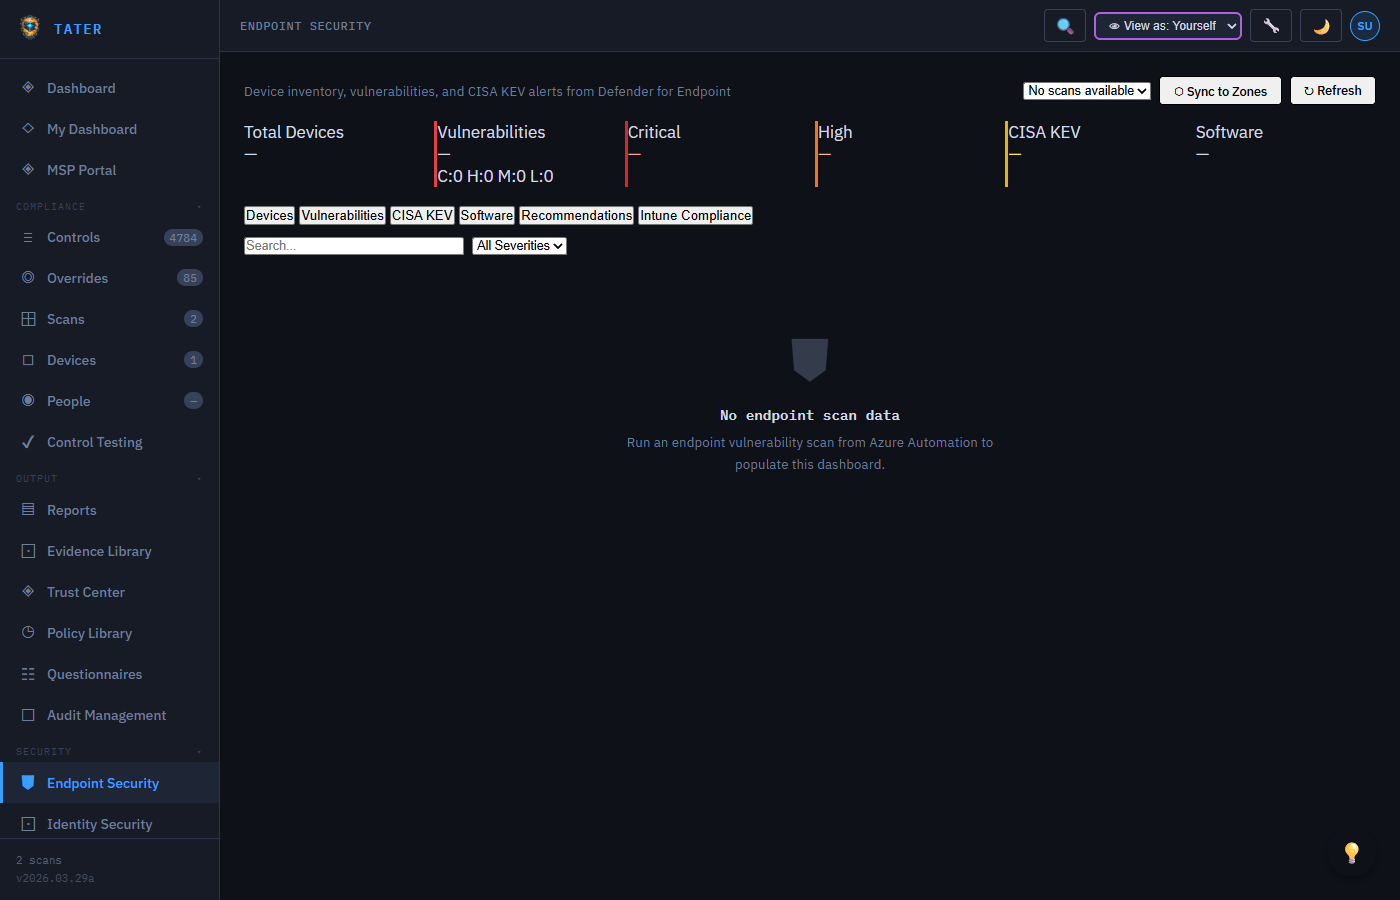
The Endpoint Security dashboard provides an organization-wide view of endpoint security posture with six tab views:
Summary Cards
- Total Devices: Count of all devices in the fleet
- Vulnerabilities: Total CVE count broken down by severity
- Critical: Number of critical-severity CVEs requiring immediate attention
- High: Number of high-severity CVEs
- CISA KEV: Count of actively exploited vulnerabilities across the fleet
- Software: Total unique software titles tracked
Tab Views
| Tab | Content |
|---|---|
| Devices | Full device inventory with MDE health, risk score, and vulnerability counts |
| Vulnerabilities | All CVEs across the fleet with severity, CVSS score, affected device count, and CISA KEV flags |
| CISA KEV | Actively exploited vulnerabilities with due dates, ransomware associations, and affected devices |
| Software | Software inventory with version tracking, EOL status, and vulnerability counts |
| Recommendations | MDE security recommendations with remediation guidance |
| Intune Compliance | Intune device compliance status and configuration profile results |
Endpoint Hardening Plan
The Endpoint Hardening Plan is a compliance checklist covering 1,318 CIS Benchmark controls for Windows endpoints. It is accessible from Endpoint → Endpoint Hardening in the sidebar.
Control Coverage
| Family | Controls | Scope |
|---|---|---|
| Windows 11 Enterprise | 435 | Workstations and managed desktops (W11E_* IDs) |
| Windows Server 2019 | 286 | Server workloads - DCs, application servers (SRV19_* IDs) |
| Windows Server 2022 | 287 | Server workloads - DCs, application servers (SRV22_* IDs) |
| Windows Server 2025 | 310 | Next-generation server environments (SRV25_* IDs) |
Status Sources
Each control's status in the hardening plan is resolved from the most recent endpoint scan:
- Pass - control evaluated and compliant in the latest scan
- Fail - control evaluated and non-compliant; remediation available
- Manual - control requires human verification; cannot be automated
- Not Scanned - no scan data exists yet for this control; deploy the TATER Agent to get results
Filters and Bulk Selection
- Severity filter - show only Critical, High, Medium, or Low controls
- Status filter - limit the view to Pass, Fail, Manual, or Not Scanned controls
- Bulk select - check multiple controls and trigger remediation for all of them in one batch
One-Click Remediation
Each control with a corresponding remediation script shows a ⚡ Remediate button. Clicking it triggers the Run-Remediation.ps1 Azure Automation runbook, which:
- Downloads the control's PowerShell script from blob storage (
Remediations/{family}/REM_{family}_{NNN}_*.ps1) - Downloads the shared helper library (
Remediations/REM_WIN_Helpers.ps1) - Executes the script on the target endpoint via the runbook's managed identity
- Captures pre/post state and writes a structured JSON run log
- Reports success or failure back to the TATER API
The remediation system must be enabled and a webhook URL configured in Settings → Remediation before the ⚡ Remediate button appears. See the Settings Reference → Remediation for setup details.
Structured Run Logs & AI Analysis
After a batch remediation completes, the hardening plan generates a structured JSON run log capturing the pre/post state of every control that was acted upon. You can:
- Download the run log from the plan panel's Analysis tab
- Use the Copy Prompt button to generate a ready-to-paste AI analysis prompt that includes org name, device OS, control list, and expected state
- Paste the prompt into the TATER AI Analyst (or Claude Desktop via MCP) to identify patterns, confirm changes, and generate a remediation improvement report
Fleet-Wide Script Execution (Ops Script Library)
Beyond the catalog of pre-built remediation scripts, the Ops Script Library in TATER Ops lets technicians author custom PowerShell or Bash scripts and run them on up to 500 target devices in a single job via the TATER Agent. The agent's existing command channel handles execution - the same one that powers Phase 2 Interactive Remote Control.
- CRUD interface for the script library with risk levels (Low / Medium / High) and auto-versioning
- Run dialog accepts an explicit hostname list (one per line); HIGH-risk scripts surface an extra confirmation banner
- Per-target stdout / stderr capture (clipped to ~64 KB), exit codes, and durations
- Aggregated job dashboard with KPI strip and 5-second auto-poll while in-flight
- Seven MCP tools (
list_scripts,get_script,create_script,update_script,execute_script,get_script_job_status,list_script_jobs) so an AI agent can drive the full lifecycle from chat
See the dedicated Ops Script Library guide for the full feature reference.
MDE Device Bridging
TATER automatically bridges devices discovered through MDE into the fleet management system:
- After an endpoint scan completes,
bridgeEndpointScanDevices()runs automatically - Existing devices are enriched with MDE data: health status, risk score, exposure level, last seen
- New devices not already in the fleet are auto-created with type "workstation" and a note indicating MDE auto-discovery
- Global maps are populated:
window._mdeVulnMap,window._mdeSoftware,window._mdeKevMap
Archiving Devices
Devices that are decommissioned or no longer in use can be archived:
- Select one or more devices and click Archive
- Archived devices are moved out of the active fleet view but retained for historical records
- Archived devices can be restored at any time from the archive view
- Compliance scores and reports exclude archived devices by default
Smart App Discovery
TATER automatically discovers trackable software from endpoint scans and creates compliance zones for monitoring:
How Discovery Works
- The
autoRegisterDiscoveredApps()function runs at initialization after endpoint scan data loads - Software is matched against the
_TRACKABLE_SOFTWAREallowlist (80 entries covering common enterprise software) - Applications meeting criteria are auto-registered as compliance zones:
- Has known vulnerabilities
- Installed on 5+ devices
- Is marked as End-of-Life
- Discovered zones have IDs prefixed with
disc-and are marked withisDiscovered: true
Version Lifecycle Badges
Discovered applications display version lifecycle status badges sourced from the endoflife.date API:
| Badge | Meaning |
|---|---|
| Up to Date (green) | Running the latest supported version |
| Update Available (yellow) | Minor update available within the same major version |
| Major Update (orange) | Major version upgrade available |
| EOL (red) | End-of-Life; no longer receiving security updates |
Linux Compliance Controls
The TATER Agent for Linux runs 60 bash-based compliance controls covering CIS Linux Benchmark areas. Controls are executed by the agent on each scan cycle and results are uploaded to the TATER API.
Control Coverage
| ID | Control |
|---|---|
LNX_001 | Firewall enabled (ufw / firewalld / iptables) |
LNX_002 | SSH hardening (PermitRootLogin, PasswordAuthentication, Protocol 2) |
LNX_003 | Disk encryption (LUKS via lsblk / cryptsetup) |
LNX_004 | Automatic security updates (unattended-upgrades / dnf-automatic / yum-cron) |
LNX_005 | Password policy (/etc/login.defs + pam_pwquality) |
LNX_006 | No empty passwords (/etc/shadow audit) |
LNX_007 | NTP time synchronization (timedatectl / chrony / ntpd) |
LNX_008 | Mandatory Access Control enabled (SELinux / AppArmor) |
LNX_009 | auditd running and enabled |
LNX_010 | Kernel hardening (sysctl: ASLR, ip_forward, dmesg_restrict) |
LNX_011 | Core dumps disabled (limits.conf + suid_dumpable) |
LNX_012 | USB storage module blacklisted (modprobe.d) |
LNX_013 | Syslog service running (rsyslog / syslog-ng / journald) |
LNX_014 | Package updates applied within 30 days |
LNX_015 | Failed login monitoring (fail2ban / pam_tally2 / faillock) |
LNX_016 | No unrestricted sudo (NOPASSWD: ALL not present) |
LNX_017 | No world-writable directories outside /tmp |
LNX_018 | /tmp mounted with noexec, nosuid flags |
LNX_019 | Antivirus present (ClamAV / Sophos / other) |
LNX_020 | Guest account disabled |
The table above shows the first 20 controls. The full set spans LNX_001–LNX_060 and additionally covers SSH hardening depth (MaxAuthTries, idle timeout, banners, ciphers), auditd rules and immutability, mount options for /var/tmp, /dev/shm, and /home, sysctl network hardening, password aging policy, umask defaults, GRUB permissions, and AIDE file integrity monitoring.
Linux Agent Installation
Download the Linux agent package from Settings > Endpoint Agent and run the install script:
# Download and install (amd64)
wget https://www.tatersecurity.com/Agent/tater-agent-linux-amd64.tar.gz
tar -xzf tater-agent-linux-amd64.tar.gz
sudo TATER_API_BASE="https://api.tatersecurity.com/api" \
     TATER_API_KEY="your-api-key" \
     TATER_TENANT_ID="your-tenant-id" \
     TATER_ORG_ID="your-org-id" \
     bash install.sh
The installer places the binary at /usr/local/bin/tater-agent, creates the data directory at /var/lib/tater, and installs a systemd unit (tater-agent.service) that starts on boot. Controls run from /var/lib/tater/Controls/Linux/.
The Linux agent is available for both amd64 (x86-64) and arm64 architectures, supporting Raspberry Pi, AWS Graviton, and Apple Silicon (via Lima/Rosetta). Download the appropriate binary from Settings > Endpoint Agent.
EPSS Scores
The Exploit Prediction Scoring System (EPSS) provides a probability score (0-1.0) estimating the likelihood that a vulnerability will be exploited in the wild within the next 30 days. TATER displays EPSS scores alongside CVSS scores to help prioritize remediation:
- EPSS scores above 0.5 indicate a high probability of exploitation
- Combined with CISA KEV flags, EPSS helps identify the most urgent vulnerabilities
- Sort the vulnerability table by EPSS to focus on the most likely-to-be-exploited CVEs
CISA KEV Integration
The CISA Known Exploited Vulnerabilities catalog is downloaded during each endpoint scan and cross-referenced with MDE CVE data:
- KEV-flagged vulnerabilities display a red badge in all vulnerability views
- The CISA KEV tab shows all actively exploited CVEs affecting your fleet
- Ransomware campaign associations are tracked (e.g., "Known" ransomware use)
- Due dates from CISA directives are displayed for federal agency compliance
- An alert banner appears when new KEV entries match vulnerabilities in your fleet